Level 17
Load Testing
Load Testing with JMeter

Load Testing
Load testing (or performance testing) is automated testing that simulates a certain number of users working in an application. The goal of load testing is to find the boundary load conditions under which the system keeps running stably with an acceptable response time, and also to assess the system's ability to function correctly when the planned load is exceeded.
Types of Load in Testing
More specifically, the following types of load testing are distinguished:
1. Performance testing – measures the speed of the system under ideal conditions and maximum load.
2. Load testing – the same performance tests, but with the system subjected to various loads.
3. Volume testing – the application is loaded with a large amount of data to determine when the conditions are reached under which the system stops working.
4. Stress testing – the behavior of the system when resources run short (CPU resources, disk space, network outages, and so on). Stress testing lets you check how well the application and the system as a whole hold up under stress, and also assess the system's ability to recover, that is, to return to a normal state after the stress is removed. In this context, stress can mean raising the intensity of operations to very high values or an emergency change to the server configuration.
5. Stability or reliability testing (Stability / Reliability Testing).
The goal of stability (reliability) testing is to verify that the application keeps working during prolonged operation (24 hours or more) under an average load. Operation times play a secondary role in this type of testing; stability takes first place: no memory leaks, no server restarts under load, and other aspects that affect stability specifically. In stability testing, the duration is dictated only by business logic, and it can last a week, a month, or longer.
Types of Operating Modes
Normal operating mode – acceptable parameters of the application's operating mode, for example, the number of users working with the web application at the same time.
Peak load – short-term operation of the server and web application with more than the normal number of users.
Connection type – users connecting to the web application server either evenly (over some period of time) or in a peak pattern (simultaneously, quickly).
Load Profile – a set of operations with different load intensities, defined by analyzing the requirements for the system under test.
Load testing includes:

1. Testing under the working load
2. Testing under increased load
3. Peak load testing
4. Testing with large volumes of data
5. "Dying gracefully" testing
6. Tuning and playing with settings
7. "Hardware" questions
8. Assessing system survivability
9. Recommendations for the patient
Goals and objectives of load testing
At the design stage.
- Which system architecture is better: three-tier or four-tier? Where and how should files be stored? Will the chosen language and database deliver the performance we need? And so on.
At the programming stage.
- Which database schema is better? Should we give up DB normalization in favor of performance, or the other way around? How should the GUI be built? What is better: triggers or foreign keys?
- Which part of the code should be optimized first?
At the testing stage:
- The maximum performance of the system.
- Determining how much the response time and operation duration grow as the load increases.
- Determining the limit of the program's applicability in terms of the number of users.
- Determining how the system configuration affects performance.
- The peak load on the system.
At the delivery stage:
- Do the architecture and network configuration meet the performance requirements?
A classic mistake is to run performance testing only at the testing stage.
Working with Requirements, or Torturing Your Colleagues

In load testing, the tester is the one who drafts the technical specification for building the load tests. It's great if you get ready-made requirements written for you by an analyst, but most likely you should be prepared to design them yourself. The first source for the requirements is the technical specification for the software development, along with all the accompanying documentation. If there is a problem with such documentation, we get down to torturing our colleagues, namely:
1. Get the requirements from the customer
2. Analyze them with the analyst and get statistical data from them
3. Interview the developer to find out the real parameters and possible thresholds of the system. Agree the load specification with them
4. Interview the admins / DevOps to check that the collected requirements are still up to date
5. Switch on your brain and create the final document
6. Be sure to agree the schedule and the procedure for running the load tests with the admins.
Types of Test Servers

In our practice, we have come across 4 main categories of test servers. But this classification is not rigid and depends heavily on the development approach. The main classes are:
1. Local server. Your software deployed on your own computer. Convenient for functional testing. Not used for load testing.
2. Test server. A very broad concept; there are usually many test servers, and each programmer may own a test server of their own, where they deploy their finished code. But if the company is small, there may be just one test server. Can be used for load testing.
3. Pre-release server. A more powerful server than the test one; it is where the finished version is built and integration testing with other components is done. The best fit for load testing.
4. Production server (Production). The server your customers or users work with directly. The tested version (Pass QA) is rolled out to it. Running load tests on production is strongly discouraged. You can easily bring it down with the load, and that would be a disaster. It is possible to use a dedicated cluster of the production server, provided users are disconnected from it while the tests run.
The Test Environment, or the Rakes We Keep Stepping On
In load testing, a LOT depends on the configuration of the test environment. In nature, there are only three possible relationships between the test server and the production one:
a. The test environment equals production
b. The test environment is architecturally equal to production
c. The test environment is not equal to production
The Test Environment Equals Production
The simplest and most convenient case. Our actions:
- Install the version and run smoke testing on it
- Apply load according to the plan
- Tune it and polish it up
- Go to production
The Test Environment Is Architecturally Equal to Production
In this case, you'll have to fiddle with the settings and with processing the test results. Our actions:
- Think about how to install the version and where to trim or cut things down
- Trim and/or shrink the databases if needed
- Install and test the version
- Apply load according to the plan
- Tune it and polish it up
- Interpret the results
- Go to production
The Test Environment Is Not Equal to Production





The problem of architectural inequality between the test server and the production one is actually very deep and has its share of pitfalls. If your application is compact enough, buying a separate server where you can deploy
test versions is no problem. It is a different story when you deal with large, complex systems such as mail servers, social networks, cloud storage, web platforms and the like... Testing such applications requires deploying a whole network of test machines, which ends up as a test cluster. Trying to deploy such a cluster on machines that physically sit in the development center leads to building your own data center, with all the overhead that comes with it. A good alternative is to use solutions such as Amazon Web Services.
The natural desire to save money on renting hosts or buying hardware leads to choosing machines with specs far below the production installation. Lower by a factor of several. And this is where the conversion factor between synthetic performance indexes comes into play. That is, the production CPU will be 2 times faster, it will have 4 times as many cores, 6 times as much RAM, a disk subsystem 3.5 times faster, and a network 100 times faster. We add these up, divide by the number of indicators, multiply by some correction factor, and get a conversion factor by which we will multiply the performance test results. You can come up with a more complex formula too, for example by assigning each indicator a certain weight.
On closer inspection, though, this approach turns out to be good only for preparing test suites for future testing on an installation close to production, and for catching the most obvious performance problems. (Which is already quite a lot and important.) Why? Because, for one thing, this approach completely ignores the bottleneck effect.
A real-life example. The tests were run on one host, and the application under test was on another. The test suite included requests that return different amounts of data in the response. Requests returning a relatively small amount of data gave satisfactory results, while requests returning large responses gave unsatisfactory ones.
Meanwhile, the host of the application under test was nowhere near overloaded. The conclusion suggests itself: the application handles requests with large responses poorly, yet doesn't use all of the machine's resources, so it needs to be redesigned. But what was really going on? It turned out that the low network speed made responses take a long time to transfer, which especially affected large responses and, as a result, simply made it impossible to create a heavy load on the application under test.
The test environment is not equal to production: we apply coefficients
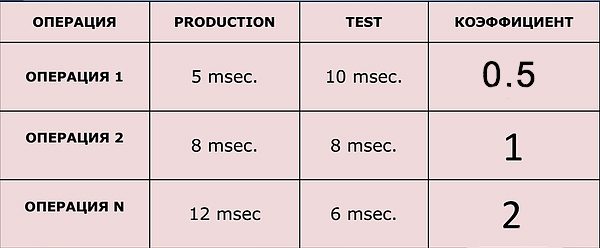
When it's hard to compare the hardware and the servers are connected over the same network channel, you can apply a coefficient determined from some standard request. In that case, you send N requests to the server and take the average time for the production server T and for the test server t. Then you calculate the coefficient with the formula k = T/t (production ÷ test). To adjust the result, you multiply the result obtained on the test server by this coefficient: R = k * t.
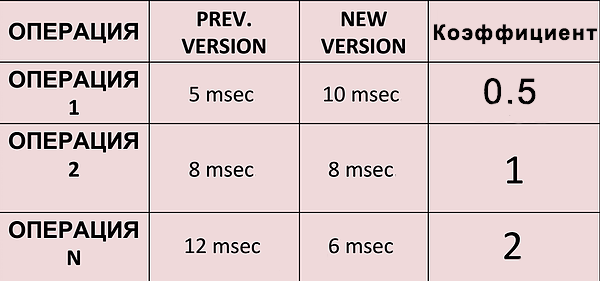
We apply coefficients in the same way when testing different versions
If the new version contains more functionality than the previous one (gets "heavier") or less (gets "lighter"), it can't be compared directly with its predecessor. In that case, transition coefficients are applied as well.
Who Needs the Load Testing Results
- The Project or Release Manager
- The Capacity manager
- The development team
- Your team lead
These Are Not Silly Questions

1. What is load testing?
2. What are the types of load testing and how do they differ?
3. What is the difference between load testing and stress testing?
4. What types of load are there?
5. What are the goals of testing?
6. What conclusions can be drawn from the results?
The Load Testing Tool: JMeter
It's logical to assume that performance testing requires specially designed software. Of course, Chewbacca would say you could just build a starship, learn a programming language from a manual, and write your own load scripts. But we won't indulge in that gloom. Instead, we'll use a ready-made, high-quality software product called JMeter.
Why this particular program, you may ask?
Because it is:
a) Free
b) Actively supported by its vendor, with new and better versions coming out
c) Well proven among testers
d) JMeter is a Java program that runs on any OS
e) It has a server-side component that can analyze the state of the server under load
So, allow us to present Apache JMeter, a tool for load testing, developed by the Apache Software Foundation.
Although JMeter was originally developed as a tool for testing web applications, it can now run load tests for JDBC connections, FTP, LDAP, SOAP, JMS, POP3, IMAP, HTTP, and TCP protocols.
Clearly, what interests us most is working with the HTTP and HTTPS protocols. Also interesting is the ability to generate a large number of requests from several computers while controlling the whole process from one of them. In addition, the program's architecture supports third-party plugins, which lets you extend the tool with new features.
Planning the Work
Load testing begins first and foremost with planning. A load testing plan made with JMeter consists of:
1. Defining the testing goals and developing load profiles.
2. Installing and configuring a bot-net for distributed testing (if needed).
3. Recording a Selenium CRUD test to use as the payload, to simplify preparing the test plan.
4. Setting up and debugging the load tests in JMeter.
5. Replaying the load tests many times according to the load profiles.
6. Analyzing the results and producing a report using the prepared template.
Installing and Configuring JMeter
1. Download and install the latest version of the JDK (JDK 8)
2. Add the environment variable JAVA_HOME and set its value to the JDK directory, for example, JAVA_HOME='c:\Program Files (x86)\Java\jdk1.6.0_27\'. How to do it.
3. Add the following string to the value of the environment variable Path: ;%JAVA_HOME%bin
4. Download Apache JMeter from this link and unpack it. It's best not to rename the JMeter subdirectories.
5. Add the environment variable JMETER_HOME and set its value to the JMeter directory, for example, JMETER_HOME='c:\apache-jmeter-2.7\'
6. Add the following string to the value of the environment variable Path: ;%JMETER_HOME%bin
7. Download the jp@gc plugins from this link, for example, JMeterPlugins-0.5.3, and unpack them.
8. Copy the file JMeterPlugins.jar from the directory with the unpacked jp@gc plugin to the directory %JMETER_HOME%lib\ext.
Collecting Load Metrics
Collecting Load Metrics from the Server
Configuring the jp@gc plugin to use PerfMon Metrics Collectors
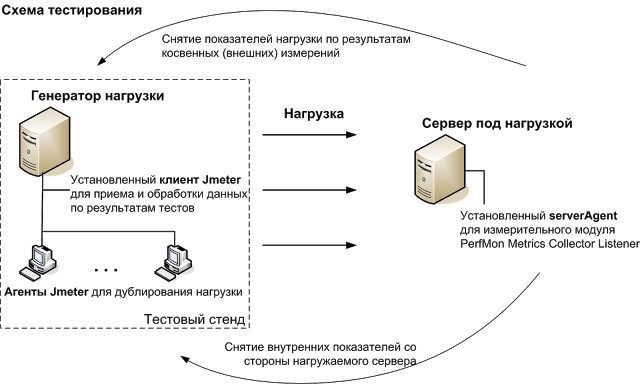
To use the PerfMon Metrics Collectors modules from the jp@gc plugin, which collect load metrics on the server side, you also need to run the JMeter server agent on every server involved in the measurement (application servers, database servers, and so on). To do that, you need to:
1. Copy the serverAgent directory from the directory with the jp@gc plugins to the server whose load you need to measure.
2. On Windows servers, run the file startAgent.bat. On Linux servers, run startAgent.sh, after first granting execute permission with the command
3. chmod a+x startAgent.sh
Once the agent is running, the PerfMon Metrics Collector Listener modules become available for connecting to the agents. You can add several servers to them for monitoring. One graph can display different kinds of metrics: CPU, memory, disk subsystem, and network adapter load, and others.
Collecting Load Metrics from the Server

By default, JMeter doesn't save some data, for example the number of threads and the number of requests, to JTL files (JMeter's own format). If you plan to work with JTL files to prepare reports, you need to open the settings file %JMETER-HOME%bin\jmeter.properties, uncomment the line containing the variable jmeter.save.saveservice.thread_counts by removing the "#" character at the start of the line, and set its value:
jmeter.save.saveservice.thread_counts=true
This will allow correct graphs to be displayed from JTL files that use the number of threads.
You also need to uncomment the line containing the variable jmeter.save.saveservice.sample_count
and set its value:
jmeter.save.saveservice.sample_count=true
This will allow correct graphs to be displayed from JTL files that use the number of requests.
After editing the settings file, open the configuration window of the plugin you need in the JMeter GUI (the Configure button) and select the Save Active Thread Counts option.
Preparing the JMeter Test Plan
To make it easier to create a JMeter test plan, use a set of Selenium end-to-end scenario tests, whose actions will be used to record the load tests. All the work with the tests can be done in the Thread Group branch of the test plan. A thread group is a group of threads. In load testing, each action gets its own autonomous thread, which the computer runs in parallel with the others.
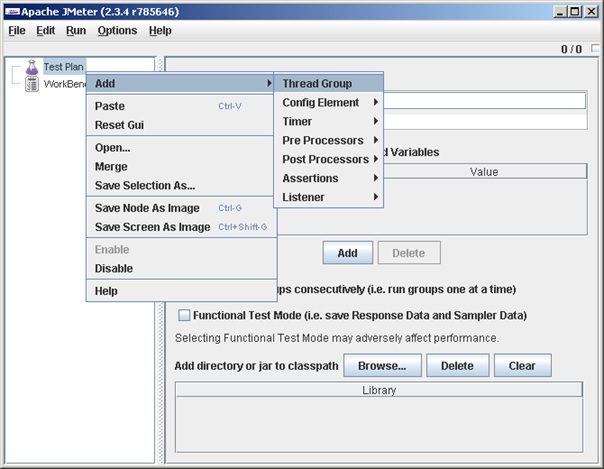
To add a Thread Group, choose Add - Thread Group from the context menu of the Test Plan element. The Thread Group element lets you set the parameters of the load generated against the application. Its main parameters are:
1. Number of threads - the number of threads (simulated users working with the site at the same time);
2. Ramp-up period - the time interval at which the next thread is started;
3. Loop count - the number of times the scenario will run inside the Thread Group;
4. Forever - the scenario will run indefinitely until it is explicitly stopped;
5. Scheduler - a scheduler for the scenario's run time;
6. Action to be taken after a Sample Error - the action taken if a request causes an error.

Preparatory Steps Before Recording: Recording Test Cases
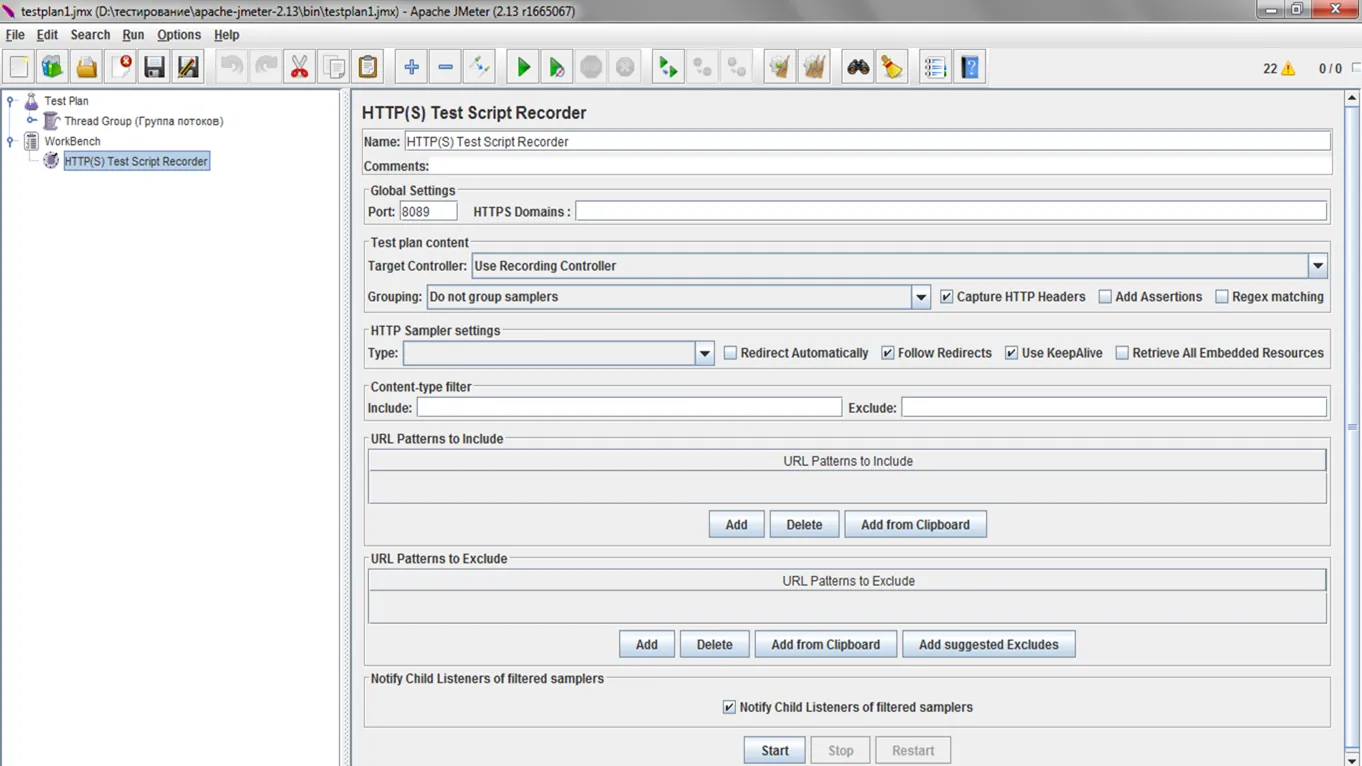
For now, let's not add the HTTP Proxy Server to the test tree. Let's first discuss where we will record the resulting "steps". Later, when we add the element to the tree, we'll see that there are several options for exactly where to record the results. You can record them straight into the "spool" (Thread), onto the "workbench" (Workbench), or into a "Recording Controller" element. I recommend the last option. First, it lets you disable (ctrl+t) the whole log at once if needed; second, it makes it easier to track and shape the structure of the test.
All the adding and editing is done via the context menu with a right mouse click. The created elements can simply be dragged and dropped.
So: Test Plan -> Add -> Threads ->Thread Group; Thread Group -> Add -> Logic Controller -> Recording Controller.
I strongly recommend giving all the elements clear names right away.

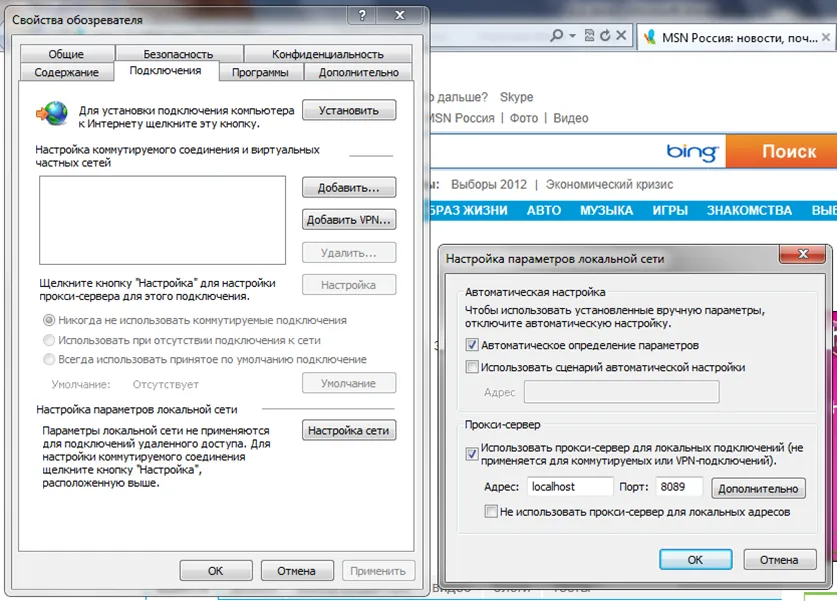
Debugging the Script
Debugging the script means removing the various .jpg and .png files and links to third-party resources. In my script, more than half of the requests are such third-party resources: connections to various social networks, links to fonts on fonts.gstatic.com, and also the IT school site. All of this can be cleaned out (with the Delete key). In general, you can clean out the .js files too. The main thing is to find the request that carries your user's credentials in its body. And, for elegance, find the request that leads to the page where the user logs in. Together, they model the sequence of user actions "opened the page, then logged in".
Let's assume we were lucky enough to pick out the necessary requests. Or, well, we think we picked them out. Let's give them readable names! To check whether we picked out the right ones, we need to run the script.
Authorization
If you need to authorize on the server for testing, add an HTTP Authorization Manager at the top of the tree (Thread Group – Add – Config Elements – HTTP Authorization Manager). It's intuitive. Enter the address of our resource there, with http:// (this is mandatory), along with the username and password.
If the Authorization Manager is needed to authorize on the server, then cookies are definitely used when logging in to the site. Add a Cookie Manager after the Authorization Manager (TestPlan – Add – Config Elements — HTTP Cookie Manager). You should probably always add this element whenever the user has to log in.

Recording Reports
To visualize and log test results, JMeter provides Listeners (Listeners). Listeners come in several types:
- Graph Full Results - displays the test results as a graph;
- Graph Results - displays the main test results (deviations, averages) as a graph;
- Spline Visualizer - displays the test results as a graph with averaged (smoothed) values.
- As well as Summary report , View results in Table
You need to add a Listener element to the Thread Group. To do so, choose Add - Listener from the Thread Group context menu. A list of listeners opens. It should include both the standard ones and the additional graphical jp@gc plugins from Google for drawing graphs.
Recommended Minimum Set of Modules for a Test Plan
We recommend including the following modules in every new test plan (each of them has an online help system; just click the Help on this plugin button):
1. Add an HTTP Test Script Recorder to the WorkBench branch, for the initial recording of test scenarios, if the application works over the HTTP protocol.
2. Add a Uniform Random Timer randomizer with a value of 100-200 ms to the Test Plan branch.
3. Add HTTP Request Defaults to the Test Plan branch to configure default requests, if the application works over the HTTP protocol.
4. Add an HTTP Cookie Manager to the Test Plan branch if the application uses cookies.
5. Add the required number of Thread Groups to the Test Plan branch; they act as separate test cases into which the data from the proxy server should be recorded.
6. Add the standard tabular reports on the test results to the Thread Group branch: Summary Report, View Results in Table, View Results Tree.
7. Add the standard graphical reports on the test results to the Thread Group branch: Graph Results, Spline Visualizer.
8. Add the graphical reports of the jp@gc plugin to the Thread Group branch: jp@gc - Response Times Percentiles (shows data access percentiles), jp@gc - Response Times vs Threads(shows how the response time changes depending on the number of running threads), jp@gc - PerfMon Metrics Collector (for getting data on CPU, Memory, Swap, Disk I/O, Network I/O and other load from the server side, from the JMeter agents).
9. At the end of the Test Plan branch, add Monitor Results to track the state of the server during
the test run.
Alternatives to JMeter
HP Loadrunner - a powerful tool that enjoys recognition in some companies. Its obvious downside is that it's expensive.
Siege - an alternative free program similar to JMeter; you can read its detailed description
Load impact - a program for load testing through a web interface. The server does everything for you, but as always in such cases, there's no flexibility.
Loadstorm - also testing through a web service.
Practice and Homework

Here are the instructions for your practical assignment:
1. Make sure Java is installed on your PC; these days it lives on almost every machine. If it isn't, hurry up and install it.
2. Install JMeter on your computer
3. Create an access log for the site software-testing.ru/ If the access log is empty for now, nothing stops us from filling it up a bit by running whatever crawler comes to hand over the site, for example HTTrack or Xenu. If the web server is IIS, you first need to switch the log format to NCSA, which the JMeter parser understands. It's not a good idea to take the log from a running server (while it is still writing to it); it's better to take one that is already closed, say, yesterday's, or to pause the web server while you extract the log. It's worth opening the log in a text editor to check that it's correct. You'll get help with this assignment from the Master further on.
The result of your work will be screenshots of the graphs and tables
and a log file with the records of JMeter's work. Everything needs to be
packed into an archive, uploaded, and submitted through the form.
You also need to carry out a basic analysis of your
results:
at what point in time and with how many
users the growth of throughput stops, when the first HTTP errors appear, and when
they exceed the 3% threshold. Here is an example of the report: make your own copy of it.
And of course, you are eagerly awaiting the level test
Generating the Log File (a List of Pages to Test)
To keep this assignment simple, we won't use any scenario; we'll just put load on a set of the site's available pages. For that, we need to get a list (a map) of the site's URLs. Since modern sites have started using protection against scanning, it's convenient to use scanners through a browser add-on. For example, Link Klipper for Chrome. This app will scan the domain address and produce a list something like this:
http://software-testing.ru/user/forgot.php
http://software-testing.ru//user/user_add.php
https://top100.rambler.ru/top100/
http://software-testing.ru/app/
https://www.facebook.com/gorod.dp.ua/
...
Links to external sites, like the ones in red, should be deleted; otherwise they will spoil the test results with unreliable data. Then we do a global replace of the part 'http://test.local' with '" GET' (a quotation mark followed by a space), and we get
"GET /index.php
"GET /news/event-12.php
...
It's better to use Notepad++ for an operation like this, because Word adds special characters.
Note that the domain name is not included in the link, only the internal path. The domain itself is specified in the JMeter settings. Each link must be on a new line, and the document must be in plain text format.
Editing the Test Plan
1. Open ApacheJMeter.jar
2. On the left we see a tree of 2 nodes: TestPlan and Workbench (we forget about the second one right away; we won't need it). Right-click Test Plan and choose Add->Thread Group. (The interface has lots of features of varying usefulness, but we won't get distracted right now; we'll take the shortest path to our test, and later, if we feel like it, we'll study JMeter's extensive capabilities in more detail.)
Adding the Log File
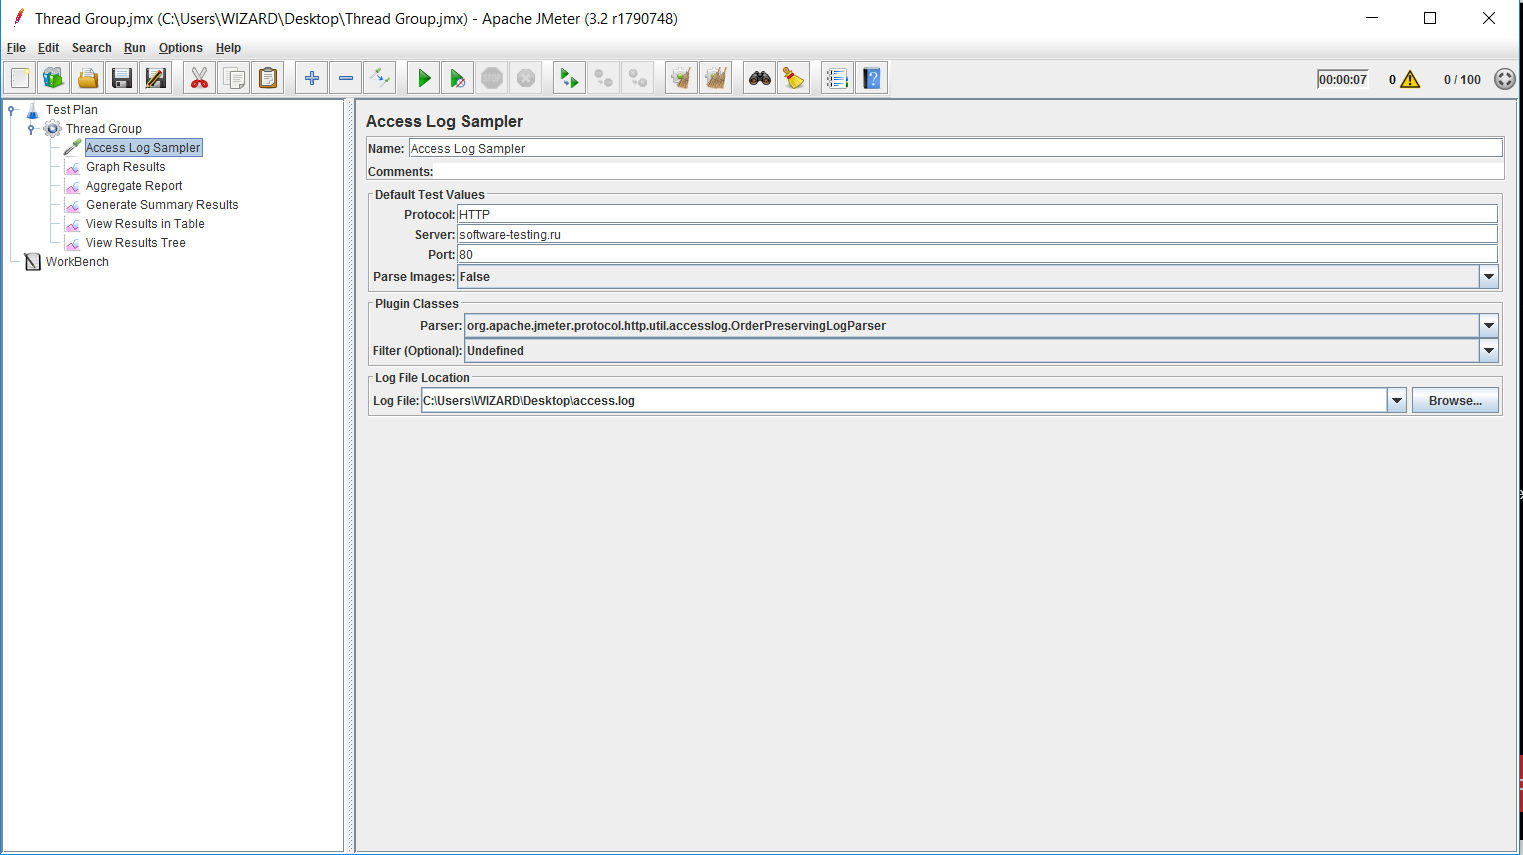
- Right-click Thread Group and add an Access Log Sampler (Thread Group->Add->Sampler->Access Log Sampler)
- Fill in the data for access.log Enter the server address (domain name only) Choose the protocol: HTTP or HTTPS, entered in capital letters Set the port to 80 Specify the path to the access.log file on your PC
Adding Report Generators
Now we add display tools to the test:
1. Thread Group->Add->Listener->View Results in Table
2. Thread Group->Add->Listener->Graph Results
3. Thread Group->Add->Listener->Aggregate Report
In View Results in Table, you need to fill in the Filename field (if you don't specify a path, the log file will be created next to jmeter.bat). You need to create the log for debugging, because JMeter's GUI doesn't show any useful information about errors.
The test plan is ready, so we move on to testing it :) and debugging (don't worry, it might well work on the first try).
File->Save, and do this every time after making changes to the test plan. This is important: JMeter sometimes freezes, and you end up having to restore the test from memory.
Run->Clear All (you can skip this the first time, but you'll need it later anyway).
Run->Start.
And we go look at View Results in Table. If we're lucky, there will be a single row with a green check mark in the Status column.
Result of the Preparation
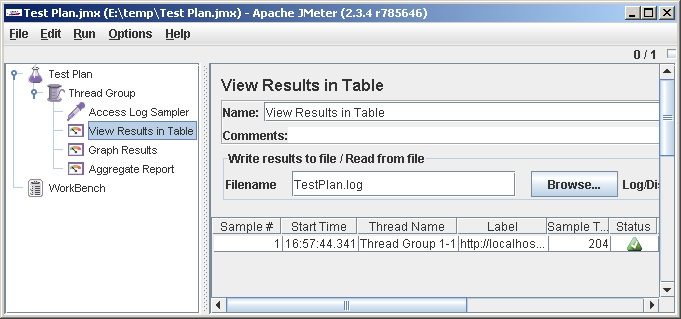
We run it (File->Save, Run->Clear All, Run->Start). Then we go look at View Results in Table. It should come out something like this:
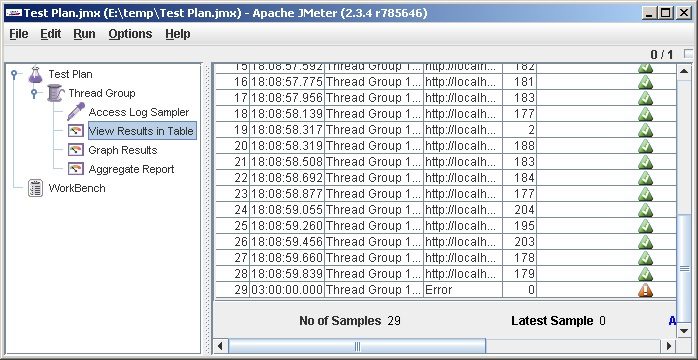
Finally, Running the Test
Before starting the test, let's add a random delay (Uniform Random Timer) of 0-1000 milliseconds at the beginning of the scenario; it usually helps smooth out the graphs a bit. As a result, the scenario works like this: it waits a random number of milliseconds, reads a line from the log, makes an HTTP request, passes the results to the listeners, waits again, reads the next line, and so on.
Let's do the first, trial test. In the thread group properties, set: Number of Threads (users): 100, Ramp-Up Period (in seconds): 100. We're going to unleash 100 virtual users on the site, sending them into battle one at a time over 100 seconds, that is, one user per second. I pulled the numbers 100 and 100 out of thin air, but you have to start somewhere.
Let us remind ourselves once more that we stand a good chance of slowing the site down or even bringing it down (which can be bad if it's a project that's already live). OK, being of sound mind and clear memory, and aware of our responsibility for our actions, we begin.
File->Save, Run->Clear All, Run->Start and we go look at Graph Results. We see, say, a picture like this
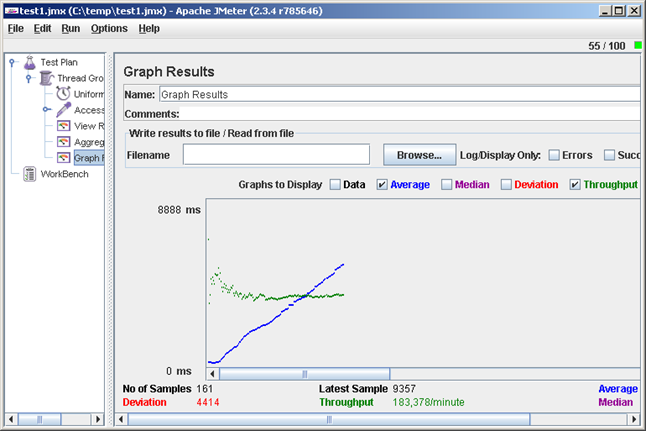

In the upper right corner you can see the current number of virtual users.
What does this graph tell us? The average response time (Average) is growing, while the processing rate (Throughput) doesn't change. This means that somewhere on the server, operations are lining up in a queue, and there isn't enough performance to serve all the requests. If we open the site in a browser, we'll see that it barely moves or doesn't respond at all. Why torment the poor thing for nothing? Run->Stop. There, the site is alive again. A bad idea during a test like this is to get distracted for a moment and, coming back a few hours later (as happens), find that the site has been down for half a day.
As a meaningful result, we got a single number: the maximum Throughput value (183 requests per minute). It can be considered the performance limit. For a start, this number may be enough; for example, it's already clear that our site won't handle 100,000 hosts a day.
Analyzing the Test Results
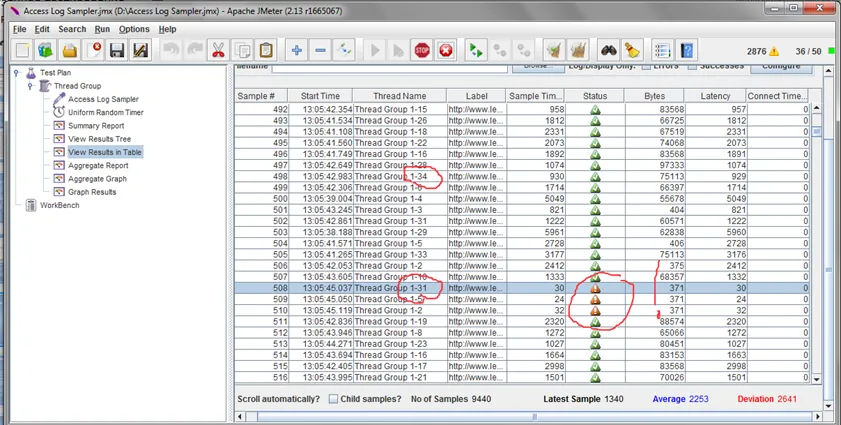
Let's run similar tests for another site. Now we'll figure out how to tell exactly when the moment of server overload arrives, using the View Table in Tree listener. We can determine that the first failures and 503 errors in the system occurred with 31-34 threads running. Consequently, the critical number of active users for the server is about 35. But keep in mind that the activity of test users is far higher than that of real people. It's unlikely anyone will click through a site at a rate of 1 page every 2 seconds.
Analyzing the Load Graph
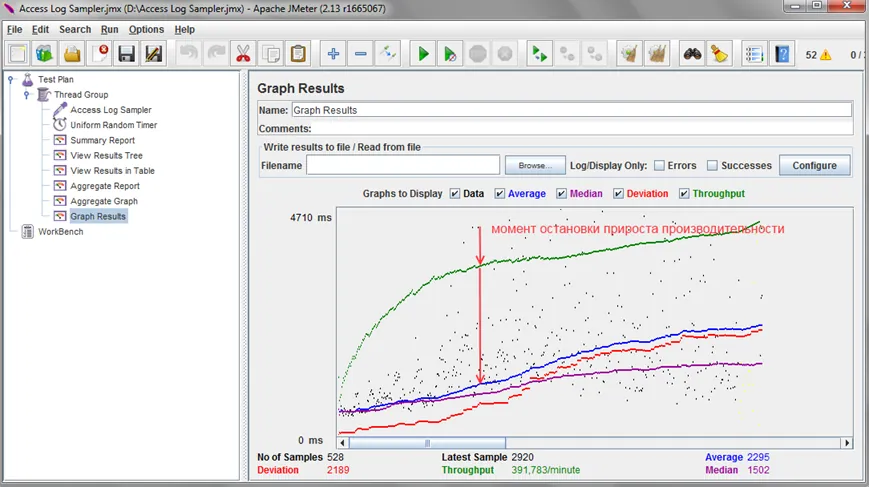
An important note: don't forget to clear the listeners before every new run. JMeter doesn't do this automatically, and if you don't wipe the previous results, everything will overlap and you'll get an intergalactic mess!
On Graph results you can look at graphs of the server's "responsiveness"
Values are given in milliseconds:
Data — the response time for each request performed.
Average — the average server response time, an objective load graph.
Throughput — the speed at which the request itself is processed.
Median — the median value (used in statistics; you can do without this data).
Deviation — the margin of error, the standard deviation.
By the way, while JMeter is "frozen", the testing process usually keeps going, which can have unpleasant consequences if you're testing a live server.
The red arrow on the graph marks the key moment: when throughput (the speed at which requests are processed) stopped growing. Why does this matter? Because as the number of users grows, in order to keep things running correctly for all of them, you need to increase the speed at which user requests are processed. If the number of users grows while the data processing speed stays the same, it turns out that over time each user gets less and less processing time. As a result, they will wait longer and longer for a response. This is called server overload.
As the load increases, the processing time not only grows, but at some point the server will stop responding to some users altogether. Let's look at the next stage.
Analyzing the Test Results
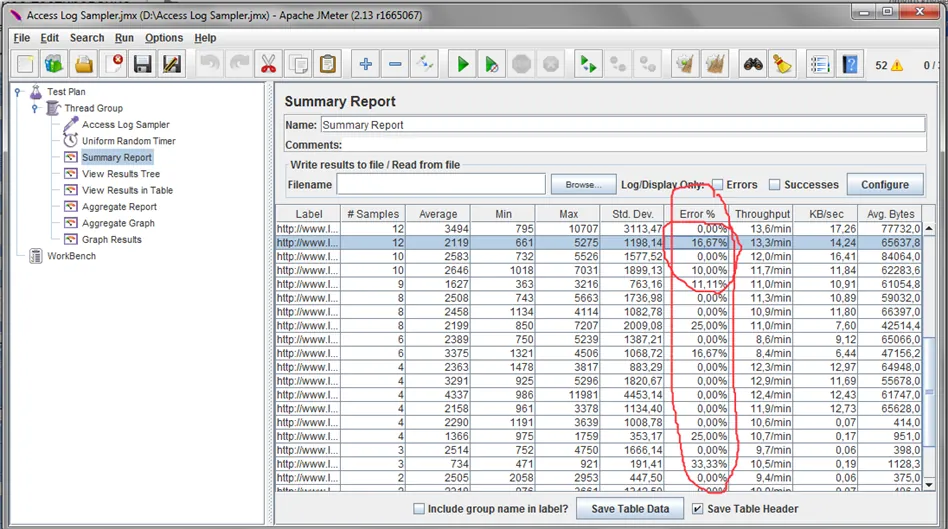
In the Summary Report you can see the summarized data and the failure rate at a given number of users
Here we are interested in the following metrics:
Samples - the number of current threads. Determines the starting point of the overload
Average - The average response time indicates how fast the site responds under load
Error% - the key parameter. The percentage of failed requests. Using this parameter, we'll work out the maximum number of users the system can withstand while the error % stays within the limits set by the requirements.
Throughput - the request processing rate
On this graph you can also see the turning point where performance stops growing, and, what's more, understand exactly what number of users became critical. The critical number of users is the one at which the server started responding to requests with an error.
Summary. Key Points in Load Analysis
1. The signal that the server is overloaded is that the average response time (Average) grows while the processing rate (Throughput) doesn't change. This means that somewhere on the server, operations are lining up in a queue and there isn't enough performance to serve all the requests. You can see this moment on the Graph Results graph. In that case, state in your conclusions the number of users N at which it happens.
2. The second metric is the appearance of server errors: 503, 505, 404, and so on. This means that, besides queuing requests and failing to process them in time, the server has started simply rejecting some of them. This is already a critical overload. You can observe it in the View Results table. Note this moment in the report.
3. The third metric is the error percentage at a given number of users. This parameter is in the Summary Report. We compare it with the requirements and put it in the report. The requirements must specify the acceptable error threshold.
4. A positive result. A tester's job isn't always just to find bugs; sometimes there are none. If the system withstood the planned load and the error percentage stayed within the norm set by the requirements, then the system successfully passes load testing, and we get PASS QA.
After analyzing these parameters, you can draw conclusions and write the load testing report. The key data in this report will be: the maximum number of users who can work without failures, the average request processing time in that mode, and the error percentage in the critical mode. Then this data needs to be compared with the requirements set for the project, and the appropriate conclusions drawn: will the system withstand the load or not.

Acceptance Report for Load Testing
The results of load testing are summarized in an acceptance report. If you ever have to do load testing at work, use this template. You don't need to fill in this report in the practical assignment. The document has the following structure:
1. Title page "Acceptance Report for Load Testing" specifying:
Application under test: the official name of the application.
Testing performed by: the engineers who took part in the testing.
Date and time of testing.
Testing stage: for example, stages 1, 2, 3 show which round of testing of the application this is, after changes to it or to the infrastructure, or after changes to the performance requirements.
Document version: for example, 1.0, which indicates the current revision of the report within a single testing stage;
Report date: the date the current version of the document was prepared.
Responsible person: the person in charge of the testing and of writing the report (the project manager or department head).
2. Table of contents.
3. Introduction.
States what the document is and gives a brief description of the application under test, which can be taken, for example, from the technical specification.
States which main functions, subsystems, or modules of the application were tested.
Testing tools used: lists all the tooling used for testing, for example, apache-jmeter-2.7, JMeterPlugins-0.5.2, Selenium IDE-1.8.1.
Appendices: all testing artifacts, for example, the JMeter test plan, .jtl files with results, charts of the measurement results, screenshots, and so on.

4. Goals and objectives. For example:
Determine whether the system's performance meets the stated requirements for the various load profiles described below.
Determine the critical load parameters that will cause the Application to fail.
5. Terms and definitions used in the report.
6. Application infrastructure.
IP address: the IP address or addresses of the servers where the Application's test environment is deployed.
Network path to the application: the network address or addresses at which the Application's interface can be accessed.
A schematic, graphical description of the Application's network structure, listing its main resources, nodes, and subsystems.
Inventory of the Application's resources. The application's resources shown in the diagram above are described in a table. The table has the columns: No., Resource, Hardware, Software.
7. Performance indicators. Lists the indicators measured at this stage and the metrics used for them. For example, the indicators given above.
8. Load profiles. Describes sets of operations with different load intensities and the conditions for running the test, for example, the required application settings, the number of concurrent users, the application subsystem under load, the test duration, and so on.
9. Performance requirements. Describes the acceptable values of the measured parameters at which the load test is considered successfully passed.
10. Description of the testing methodology. Briefly describes the approaches to testing and how the test environment was prepared, for example, the structure of the bot-net, the description of the payload, and the principle of selecting tests.

11. Measurement section, containing the summarized test results for each profile with explanations. At the beginning, you can include a table of the request types used in the load test.
12. Analysis of the test results: consolidating the measurements into summary tables and comparing them with the results of the previous testing stage (if necessary). The comparison can be presented as bar charts.
13. General conclusions and recommendations. Based on the results of load testing and data analysis, a conclusion is drawn about how well the application performs under load. For example, at what number of threads (user connections) and in what load mode it shows stable operation. Recommendations are given for ensuring acceptable work for users. Suggestions are made for improving the application's performance and ensuring comfortable work for the required number of users.
Additional Settings You May Need

You can configure some plugin parameters by editing the file %JMETER_HOME%bin\user.properties and adding the following lines at the end of it:
# Enable or disable the paint gradient for graphs. The value is true or false; the default is true.
jmeterPlugin.drawGradient = True
# Globally disable the final zeroing of lines on all graphs. The value is true or false; the default is false.
jmeterPlugin.neverDrawFinalZeroingLines = True
# Globally disable displaying the X axis (abscissa) on all the graphs concerned. The value is true or false; the default is false.
jmeterPlugin.neverDrawCurrentX = True
# Enable or disable scaling of the Y axis for readability. The value is true or false; the default is true.
jmeterPlugin.optimizeYAxis = True
# Use relative time for the time axis on the main graphs. The value is true or false; the default is true.
jmeterPlugin.useRelativeTime = True
# Output CSV separator. The default is ',' if the decimal separator is '.' or ';'. Otherwise, specify
Additional Settings You May Need
JmeterPlugin.csvSeparator =;
# Output the CSV time format (see http://docs.oracle.com/javase/7/docs/api/java/text/SimpleDateFormat.html)
jmeterPlugin.csvTimeFormat=HH:mm:ss
# Whether to prefix the plugin items in the JMeter menu. The value is true or false; the default is true.
jmeterPlugin.prefixPlugins = True
These settings are not mandatory; they are only needed to change the default behavior. If necessary, any setting can be commented out with the # character.
The options drawGradient, neverDrawFinalZeroingLines, neverDrawCurrentX, and useRelativeTime can be changed dynamically using the settings panel (SettingsPanel) of the corresponding module.
Recommended reading: